Enterprise IT Solutions

Network Monitoring for Enterprise

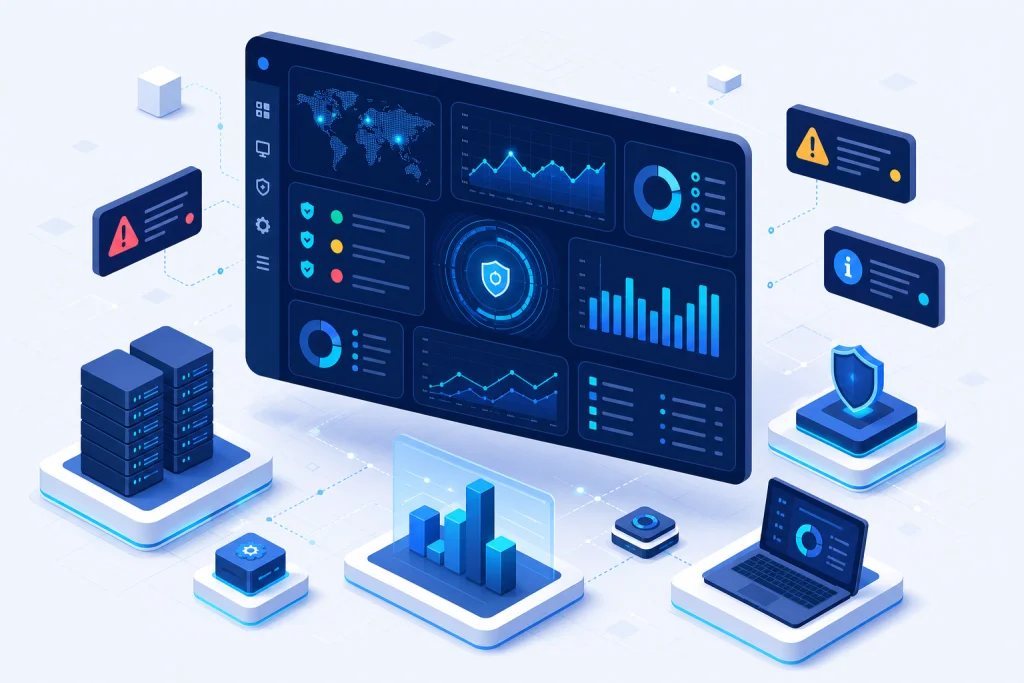
Network monitoring is the backbone of enterprise IT operations, providing real-time visibility into the performance, availability, and security of network infrastructure. In Indonesia, where digital transformation accelerates across industries—from banking to logistics—enterprises require robust monitoring solutions to ensure uptime, optimize bandwidth, and mitigate cyber threats. Key technologies include SNMP (Simple Network Management Protocol) for device polling, NetFlow and sFlow for traffic analysis, and AIOps (Artificial Intelligence for IT Operations) for predictive analytics. Modern platforms integrate with Cisco Catalyst and Nexus switches, Fortinet FortiGate firewalls, and VMware vSphere to provide a unified view. For enterprises, network monitoring is not just about fault detection; it's about capacity planning, security event correlation, and compliance with regulations like POJK for financial services. Intilogy delivers end-to-end monitoring solutions that reduce mean time to resolution (MTTR) by up to 60%, leveraging tools like SolarWinds, PRTG, and Zabbix, with custom dashboards for C-level executives. Whether managing a multi-site WAN or a hyper-converged data center, effective monitoring ensures business continuity and optimal user experience.

Network Monitoring Architecture

A robust network monitoring architecture consists of three tiers: data collection, processing, and presentation. At the collection layer, agents or SNMP polls gather metrics from routers, switches, firewalls, and servers. For example, Cisco devices export NetFlow v9 to a collector, while Fortinet firewalls send syslog and sFlow. The processing layer normalizes data, applies thresholds, and triggers alerts via platforms like Nagios or Prometheus. The presentation layer provides dashboards, reports, and APIs for integration with ITSM tools like ServiceNow. High-availability architectures use redundant collectors and failover mechanisms to ensure zero data loss. In Indonesia, where latency to cloud monitoring services can be high, on-premises collectors are preferred for real-time analysis. Enterprises often deploy a hybrid model, with local collectors at each branch and a central management server in Jakarta. Integration with IT Infrastructure solutions ensures that network monitoring aligns with server and storage health, enabling holistic root cause analysis.

Industry Use Cases for Network Monitoring

In the banking sector, network monitoring ensures compliance with BI regulations by tracking transaction latency and uptime. For example, a bank in Jakarta uses NetFlow to detect DDoS attacks on its mobile banking platform, reducing fraud incidents by 40%. In manufacturing, monitoring industrial IoT devices and PLCs over MPLS links prevents production downtime. A logistics company in Surabaya monitors its warehouse Wi-Fi from Enterprise WiFi to ensure real-time inventory scanning, achieving 99.9% uptime. Healthcare providers use network monitoring to guarantee bandwidth for telemedicine and EHR systems, with alerts for packet loss exceeding 1%. Retail chains monitor point-of-sale (POS) networks across hundreds of stores, using SNMP to detect switch failures before they impact sales. In each case, integration with Cyber Security tools provides threat intelligence, correlating network anomalies with firewall logs from Fortinet.

Network Monitoring vs Traditional Alternatives

Traditional network monitoring relied on periodic SNMP polling and manual log analysis, which often missed intermittent issues and provided limited visibility into encrypted traffic. Modern solutions use streaming telemetry, machine learning, and deep packet inspection (DPI) to overcome these limitations. For instance, while legacy tools like MRTG only show bandwidth utilization, modern platforms like SolarWinds NPM analyze application performance and user experience. AIOps-driven monitoring can predict link congestion and automatically reroute traffic, reducing downtime by 70%. In contrast, traditional methods require manual threshold tuning and lack integration with SD-WAN controllers. For enterprises in Indonesia, the shift to modern monitoring is critical as networks become more complex with hybrid cloud and IoT. Networking solutions from Cisco and Ruijie now embed analytics directly into switches, enabling proactive management. Unlike traditional alternatives, modern monitoring provides a single pane of glass for physical, virtual, and cloud networks.

Case Study & Implementation Methodology

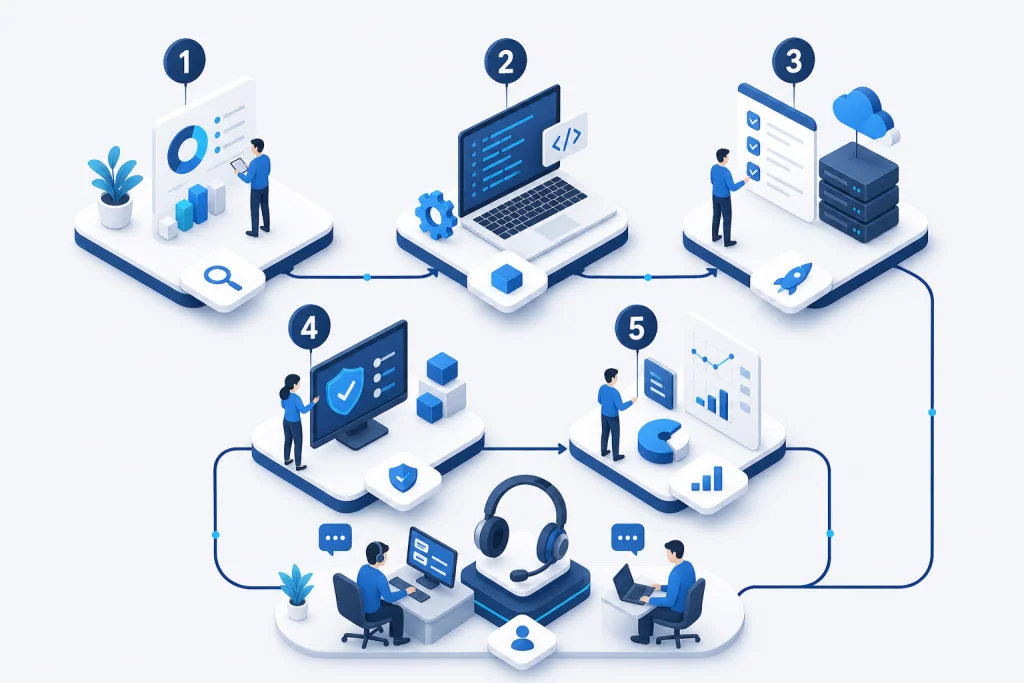
A financial services company in Jakarta with 50 branches faced frequent WAN outages, averaging 12 hours of downtime per month. Challenge: Lack of visibility into MPLS links and ISP performance. Solution: Deployed Cisco Catalyst 9300 switches with NetFlow and integrated with PRTG for real-time monitoring. Implementation followed a phased methodology: Phase 1 (2 weeks): SNMP configuration on all devices; Phase 2 (1 week): Dashboard customization for SLA metrics; Phase 3 (1 week): Alerting and escalation workflows. Result: MTTR reduced from 4 hours to 30 minutes, downtime cut by 85%, and annual cost savings of IDR 500 million from avoided lost transactions. Another case: A logistics firm in Surabaya with 200 IoT sensors per warehouse needed to monitor network latency. Using Enterprise WiFi and Fortinet FortiGate, they implemented sFlow and syslog analysis. Result: Packet loss dropped from 3% to 0.5%, and inventory accuracy improved to 99.8%.

Network Monitoring Architecture

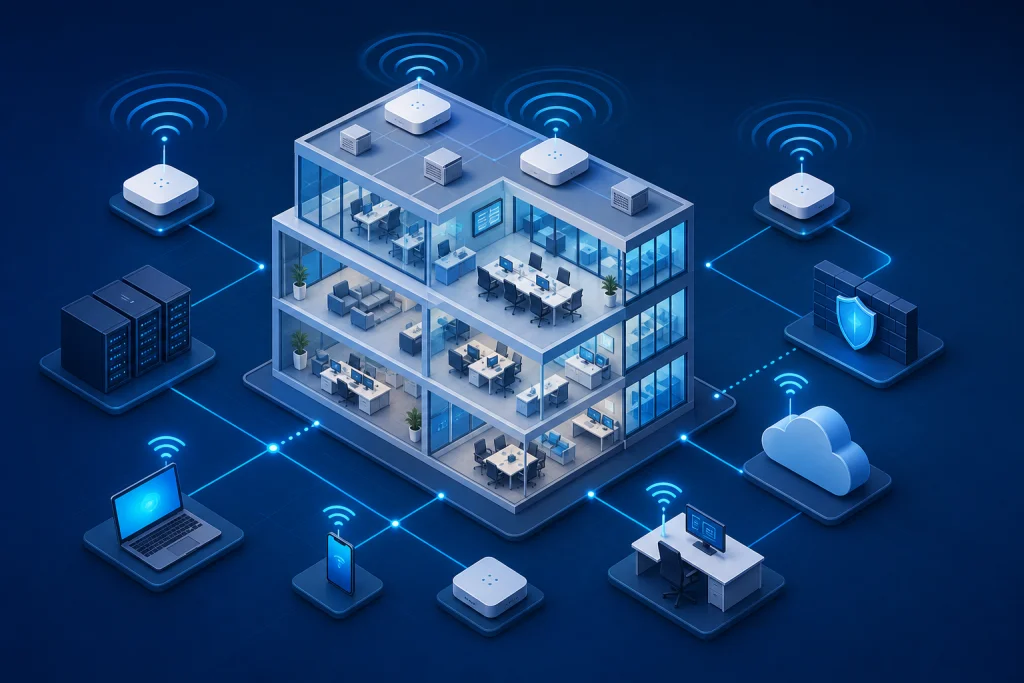
A robust network monitoring architecture consists of three tiers: data collection, processing, and presentation. At the collection layer, agents or SNMP polls gather metrics from routers, switches, firewalls, and servers. For example, Cisco devices export NetFlow v9 to a collector, while Fortinet firewalls send syslog and sFlow. The processing layer normalizes data, applies thresholds, and triggers alerts via platforms like Nagios or Prometheus. The presentation layer provides dashboards, reports, and APIs for integration with ITSM tools like ServiceNow. High-availability architectures use redundant collectors and failover mechanisms to ensure zero data loss. In Indonesia, where latency to cloud monitoring services can be high, on-premises collectors are preferred for real-time analysis. Enterprises often deploy a hybrid model, with local collectors at each branch and a central management server in Jakarta. Integration with IT Infrastructure solutions ensures that network monitoring aligns with server and storage health, enabling holistic root cause analysis.

Industry Use Cases for Network Monitoring

In the banking sector, network monitoring ensures compliance with BI regulations by tracking transaction latency and uptime. For example, a bank in Jakarta uses NetFlow to detect DDoS attacks on its mobile banking platform, reducing fraud incidents by 40%. In manufacturing, monitoring industrial IoT devices and PLCs over MPLS links prevents production downtime. A logistics company in Surabaya monitors its warehouse Wi-Fi from Enterprise WiFi to ensure real-time inventory scanning, achieving 99.9% uptime. Healthcare providers use network monitoring to guarantee bandwidth for telemedicine and EHR systems, with alerts for packet loss exceeding 1%. Retail chains monitor point-of-sale (POS) networks across hundreds of stores, using SNMP to detect switch failures before they impact sales. In each case, integration with Cyber Security tools provides threat intelligence, correlating network anomalies with firewall logs from Fortinet.

How we work

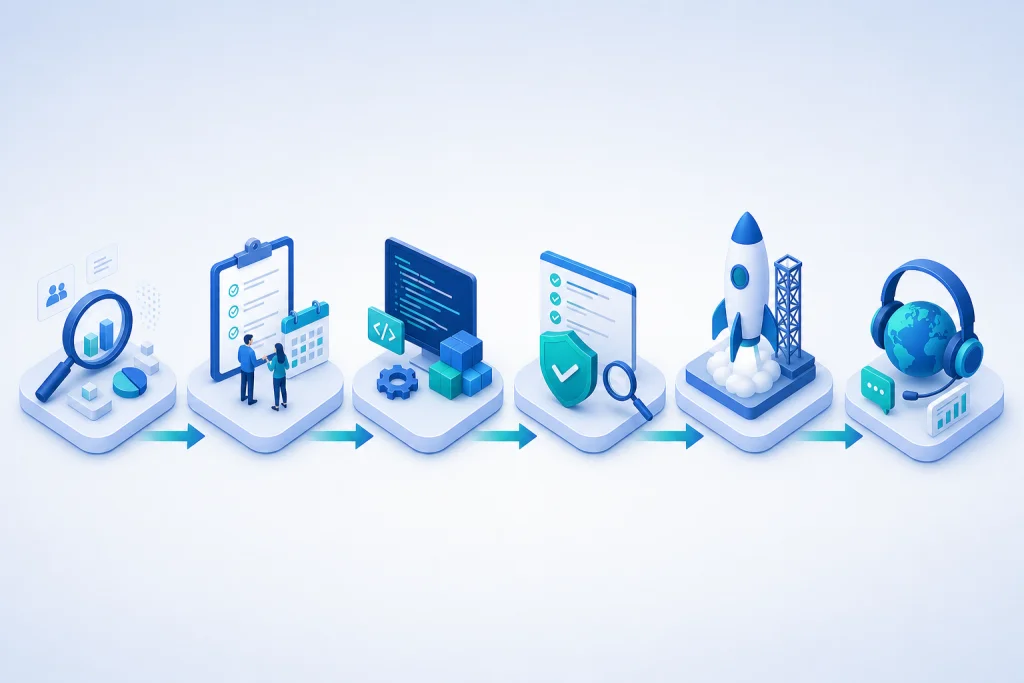
Structured delivery from assessment to handover

Each phase has clear deliverables, owners, and acceptance criteria aligned to enterprise IT practice.

Approach

Network Monitoring vs Traditional Alternatives

Traditional network monitoring relied on periodic SNMP polling and manual log analysis, which often missed intermittent issues and provided limited visibility into encrypted traffic. Modern solutions use streaming telemetry, machine learning, and deep packet inspection (DPI) to overcome these limitations. For instance, while legacy tools like MRTG only show bandwidth utilization, modern platforms like SolarWinds NPM analyze application performance and user experience. AIOps-driven monitoring can predict link congestion and automatically reroute traffic, reducing downtime by 70%. In contrast, traditional methods require manual threshold tuning and lack integration with SD-WAN controllers. For enterprises in Indonesia, the shift to modern monitoring is critical as networks become more complex with hybrid cloud and IoT. Networking solutions from Cisco and Ruijie now embed analytics directly into switches, enabling proactive management. Unlike traditional alternatives, modern monitoring provides a single pane of glass for physical, virtual, and cloud networks.

Capabilities

Case Study & Implementation Methodology

A financial services company in Jakarta with 50 branches faced frequent WAN outages, averaging 12 hours of downtime per month. Challenge: Lack of visibility into MPLS links and ISP performance. Solution: Deployed Cisco Catalyst 9300 switches with NetFlow and integrated with PRTG for real-time monitoring. Implementation followed a phased methodology: Phase 1 (2 weeks): SNMP configuration on all devices; Phase 2 (1 week): Dashboard customization for SLA metrics; Phase 3 (1 week): Alerting and escalation workflows. Result: MTTR reduced from 4 hours to 30 minutes, downtime cut by 85%, and annual cost savings of IDR 500 million from avoided lost transactions. Another case: A logistics firm in Surabaya with 200 IoT sensors per warehouse needed to monitor network latency. Using Enterprise WiFi and Fortinet FortiGate, they implemented sFlow and syslog analysis. Result: Packet loss dropped from 3% to 0.5%, and inventory accuracy improved to 99.8%.
Use cases

Perencanaan infrastruktur baru

Refresh & modernisasi

Ekspansi multi-cabang

Compliance & audit IT

Network Monitoring for Enterprise

Our engineers help design, deploy, and support enterprise IT solutions across Indonesia.

Request a quote Contact our team

Related pages

E-E-A-T · Expertise & trust

Implementation expertise & enterprise trust

Intilogy (PT. Inti Jaya Teknologi) supports IT and procurement teams across Indonesia — from technical assessment and BoQ through deployment, documentation, and post go-live support.

  • 500+ Infrastructure deployments
  • 24/7 Operational support
  • SLA Enterprise SLA
  • 150+ Clients & institutions

Engineering & delivery expertise

Engineer-led assessment

Requirements workshops, sizing, and architecture — not catalogue selling without context.

Documented deployment

Commissioning checklists, as-built diagrams, IP plans, and escalation runbooks.

Audit-ready procurement

BoQ/BOM, quotations, POs, and handover packs for tenders and IT audits.

Multi-vendor coordination

One project partner for servers, networks, security, backup, and licensing.

Vendor ecosystem & sourcing channels

We source through official distributors/resellers per brand and project. Specific partnership tiers are confirmed per RFP — see our credentials page.

Vendor Status / tier Scope Notes
Dell Technologies Authorized channel PowerEdge, storage BoQ & manufacturer warranty
HPE Authorized channel ProLiant Enterprise servers
Fortinet Implementation partner NGFW, SD-WAN Licensing & deployment
Veeam Implementation partner Backup, replication Immutable design
VMware Implementation partner vSphere Cluster & migration

Tiers vary by SKU/region. Contact sales@intilogy.com for distributor letters or engineer certificates.

Enterprise implementation methodology

Standard flow for infrastructure, security, and backup projects — scoped per contract.

  1. Discovery & assessment

    Duration: 1–2 weeks

    Deliverables Requirements & risk report

  2. Architecture & BoQ

    Duration: 1–2 weeks

    Deliverables HLD, BoQ, rollout plan

  3. Procurement & staging

    Duration: 2–4 weeks

    Deliverables Asset register

  4. Implementation & UAT

    Duration: 2–6 weeks

    Deliverables As-built, UAT sign-off

  5. Handover & operations

    Duration: Ongoing

    Deliverables SOPs, training, SLA if contracted

Support & SLA (per project contract)

Service levels are defined in agreement — example framework below.

Standard maintenance

Response
Next business day (remote)
Coverage
Firmware advisory, tickets, RMA
Notes
Indonesia business hours

Project warranty

Response
Per implementation contract
Coverage
Defects in Intilogy deployment scope
Notes
Not 24/7 unless agreed

Critical incident (optional)

Response
4–8 hours if contracted
Coverage
Production-critical escalation
Notes
Requires separate MSA

Response times are illustrative — binding only when written in contract.

Technical documentation delivered

  • Topology & rack diagrams (as-built)
  • Asset list, serials, warranty status
  • Critical config summary & change log
  • Basic operations runbook & escalation contacts
  • Restore / DR drill reports (if in scope)
  • Tender packs: distributor letters & engineer certs (on request)

Competency & certifications

Engineers train on vendor technologies per project. Individual certs (Fortinet NSE, VMware VCP, Veeam VMCE, etc.) are provided for tenders — not all listed publicly.

  • Engineer certifications — Per project technology — on request
  • Distributor letters — For procurement audit
  • Client references — See Clients page for logos & scope

View certifications & partnerships

Ready to discuss architecture & BoQ?

Our team supports assessment, recommendations, procurement, and documented implementation.

WhatsApp Consult on WhatsApp
Request Consultation WhatsApp