COMMAND CENTER SOLUTION Architecture
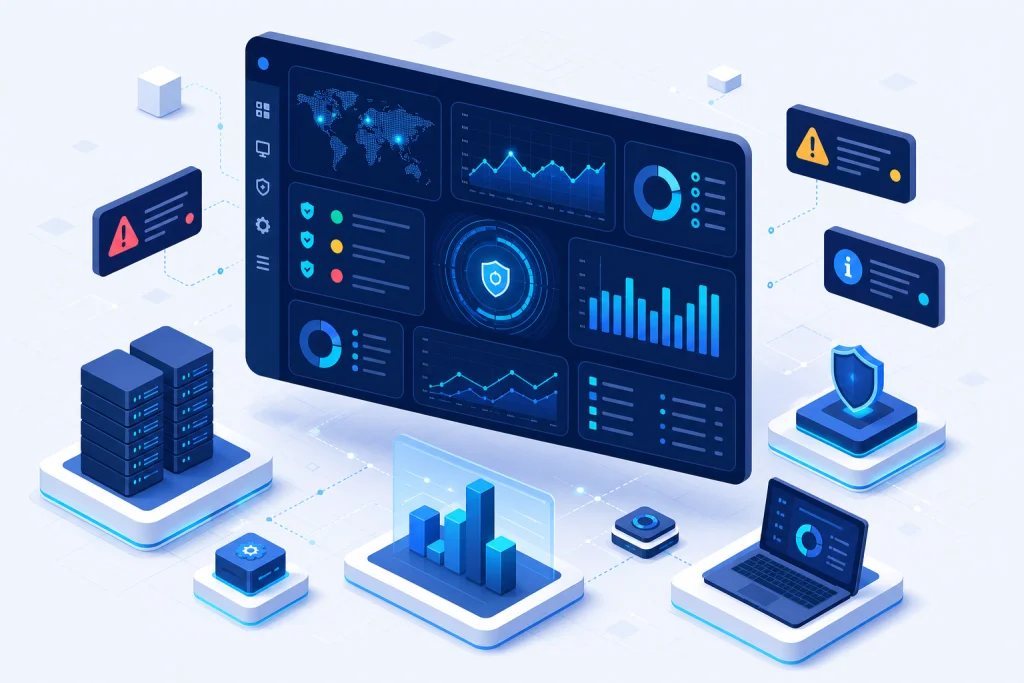
The architecture of a Command Center Solution is a multi-layered system designed for high availability and low latency. At the foundation is the data ingestion layer, which collects telemetry from various sources: network devices via SNMP, video feeds from IP cameras, IoT sensors using MQTT, and application logs through syslog or APIs. This data flows into a stream processing engine like Apache Kafka or Azure Event Hubs, which handles millions of events per second. Next, the analytics layer employs machine learning models to detect patterns and anomalies, triggering alerts. The visualization layer presents this information on a unified dashboard, often using WebGL for 3D mapping or GIS overlays. For redundancy, the system is deployed across multiple nodes with load balancing and failover, typically using hyperconverged infrastructure from vendors like VMware or Nutanix. The storage layer uses high-performance SSDs in RAID configurations, with backups to on-premises NAS or cloud. Network segmentation ensures security, with dedicated VLANs for command center traffic. This architecture supports scalability from a single room to a global operations center, with remote access via VPN for distributed teams.
A critical component is the event correlation engine, which reduces noise by grouping related alerts into incidents. For example, a temperature spike in a server room combined with a cooling system failure alert is correlated to a single 'HVAC issue' incident. This is achieved through rule-based logic and AI. The system also includes a runbook automation module that executes predefined actions, such as sending SMS notifications, creating tickets in ITSM tools, or triggering physical controls (e.g., shutting down a malfunctioning server). All communications are encrypted using TLS 1.3, and access is controlled via role-based authentication with Active Directory integration. The architecture is designed for 99.999% uptime, with redundant power supplies, UPS, and diesel generators at the facility level.
Industry Use Cases for COMMAND CENTER SOLUTION
In the transportation sector, command centers monitor real-time traffic flows, train schedules, and incident reports. For example, Jakarta's MRT uses a command center to coordinate train movements, passenger information systems, and security cameras. The system integrates with SCADA for power supply and signaling, reducing delays by 15% and improving passenger safety. In manufacturing, command centers oversee production lines, equipment health, and environmental conditions. A leading automotive plant in Bekasi deployed a command center to monitor 500+ IoT sensors on assembly robots, predicting failures before they occur and reducing unplanned downtime by 30%. The solution integrates with their MES and ERP for holistic visibility.
For energy and utilities, command centers manage power grids, oil pipelines, and water treatment plants. With Indonesia's push for renewable energy, a solar farm in West Java uses a command center to monitor panel performance, battery storage, and weather data, optimizing energy output by 20%. In security operations, enterprises use command centers to aggregate alarms from access control, CCTV, and fire detection systems. A multinational bank in Jakarta consolidated its security monitoring into a single command center, reducing false alarms by 60% and response time to incidents by 40%. The system uses AI video analytics to detect loitering or unauthorized access. Finally, in healthcare, command centers track patient flow, bed occupancy, and critical equipment status. A hospital in Surabaya implemented a command center to manage emergency response, reducing ambulance turnaround time by 25%.
COMMAND CENTER SOLUTION vs Traditional Alternatives
Traditional approaches to monitoring and incident management often involve siloed systems: separate dashboards for network monitoring, security cameras, building management, and business applications. Operators must toggle between multiple screens, manually correlate data, and rely on phone calls or emails for communication. This leads to slower response times, higher error rates, and increased operational costs. In contrast, a command center solution unifies all data into a single interface, with automated correlation and response. For example, a traditional setup might require three operators to monitor IT, security, and facilities separately, while a command center can be managed by one operator with AI assistance, reducing labor costs by 50%.
Another key difference is scalability. Traditional systems often require additional hardware and software for each new data source, leading to vendor lock-in and complexity. A command center platform is designed to be extensible, with open APIs and a plugin architecture. It can integrate with legacy systems via connectors, protecting existing investments. Furthermore, traditional solutions lack advanced analytics. Command centers use machine learning to predict failures and optimize operations, whereas traditional systems are reactive. For instance, a traditional building management system only alerts when a temperature threshold is breached; a command center can predict cooling failure based on compressor vibration patterns, allowing proactive maintenance. The total cost of ownership (TCO) for a command center is often lower over three years due to reduced downtime and operational efficiency, despite higher initial investment.
Case Study & Implementation Methodology
Client: Multinational Logistics Company (Industry: Logistics & Supply Chain). Location: Jakarta, Indonesia. Challenge: The client operated a fleet of 500 trucks and 3 warehouses, but had no centralized visibility. They experienced 15% unplanned downtime due to vehicle breakdowns and 20% inefficiency in route planning, leading to delayed deliveries and high fuel costs. Solution: Intilogy deployed a command center integrating GPS telematics, fuel sensors, warehouse IoT (temperature, humidity), and CCTV feeds. The system used AI to predict vehicle maintenance needs (e.g., brake wear) and optimize routes based on traffic and weather data. Result: Within 6 months, unplanned vehicle downtime reduced by 40%, fuel consumption decreased by 12%, and on-time delivery improved from 85% to 97%. ROI was achieved in 8 months.
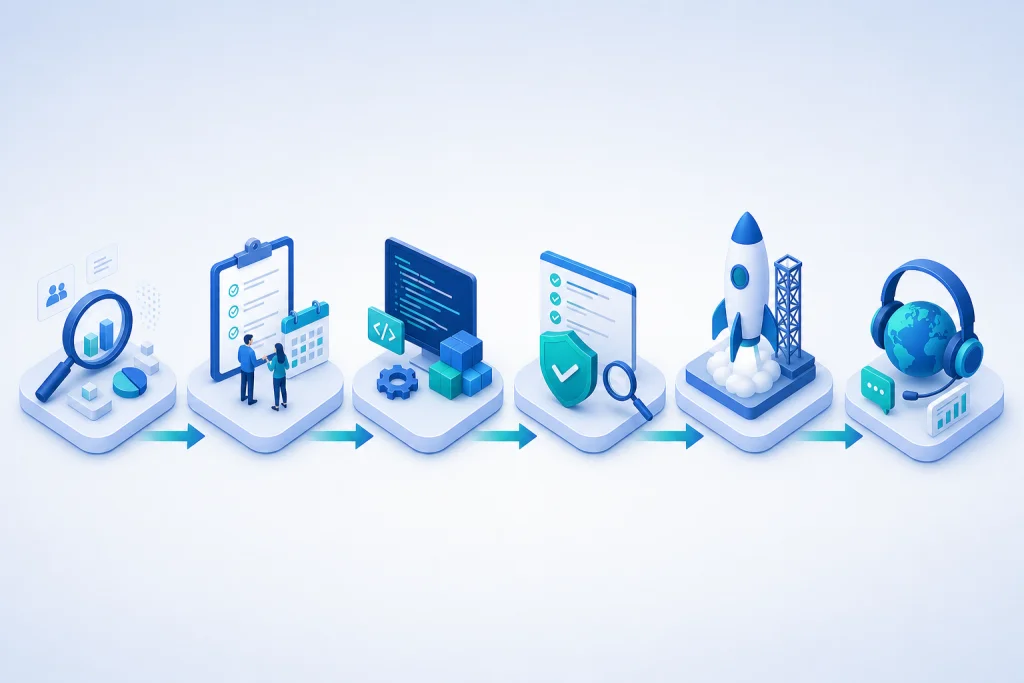
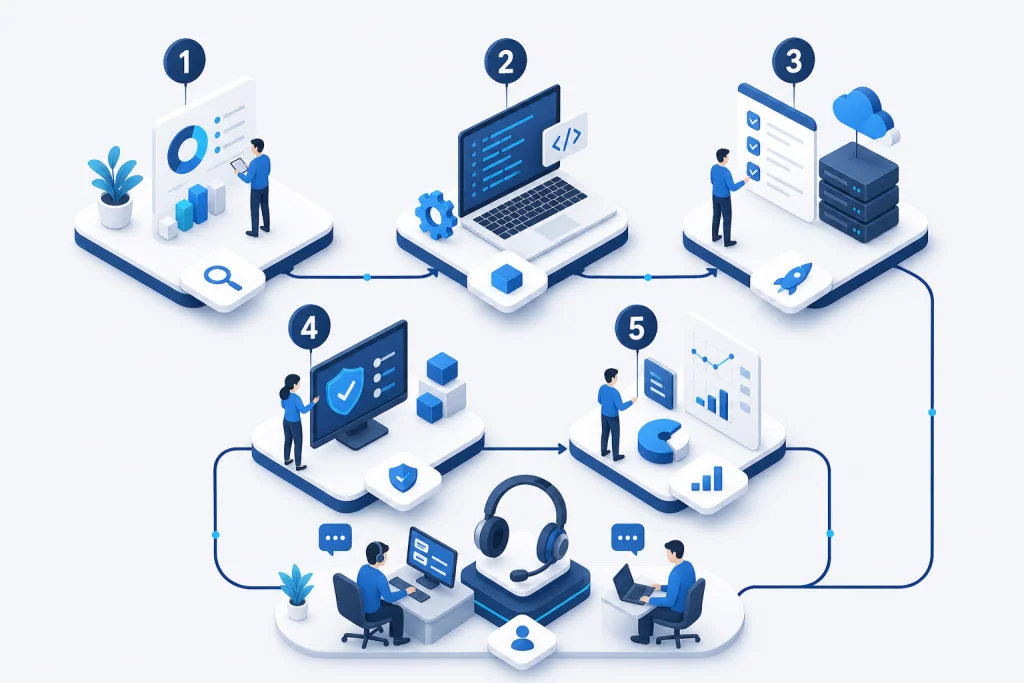
Implementation Methodology: Our approach follows a structured five-phase process. Phase 1: Discovery & Assessment – We conduct workshops to identify key data sources, pain points, and KPIs. Phase 2: Architecture Design – We create a detailed blueprint including hardware (servers, displays, network) and software stack (SIEM, IoT platform, dashboard). Phase 3: Integration & Development – We connect to existing systems using APIs, deploy agents, and build custom dashboards. Phase 4: Testing & Training – We simulate scenarios (e.g., cyber attack, power outage) to validate response workflows, and train operators. Phase 5: Go-Live & Support – We provide 24/7 support for the first month, then transition to managed services. For this client, the entire deployment took 12 weeks. We used Cisco switches for network backbone and Lenovo servers for compute. The command center room was equipped with a 3x3 video wall and ergonomic consoles. Post-implementation, we conduct quarterly reviews to optimize performance.