Central Monitoring System Architecture
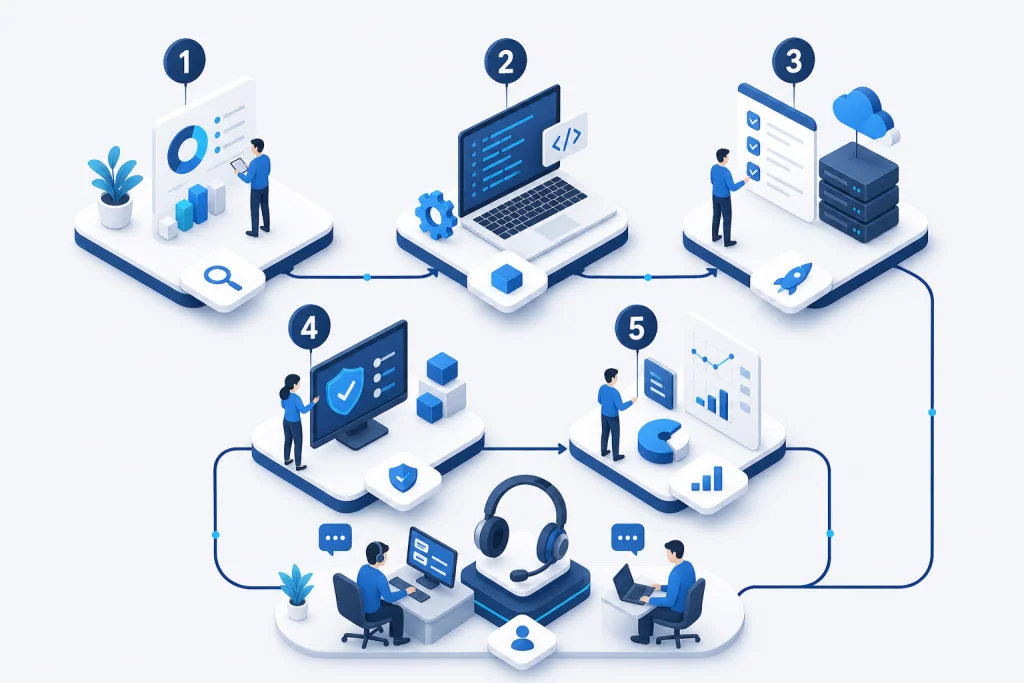
A typical CMS architecture consists of three tiers: data collection, processing/storage, and presentation. The collection layer uses agents or agentless probes deployed across the IT estate. For servers, agents like Zabbix Agent or SNMP daemons gather metrics; for network devices, SNMP polling or NetFlow/sFlow collectors are used. The processing layer normalizes data, applies thresholds, and triggers alerts. It stores historical data in time-series databases like InfluxDB or PostgreSQL for trend analysis. The presentation layer provides dashboards, reports, and real-time visualizations via web interfaces or mobile apps.
In enterprise environments, high availability is achieved by clustering the CMS server or using a primary-secondary setup. Load balancers distribute polling tasks across multiple pollers to handle thousands of devices. Integration with Hyperconverged Infrastructure (HCI) like VMware vSAN or Nutanix simplifies monitoring by exposing APIs for resource pools. For security, the CMS must support TLS encryption for data in transit and role-based access control (RBAC). In Indonesia, where network latency varies, the architecture should include local collectors at branch offices that forward aggregated data to a central server. This reduces bandwidth usage and improves reliability.
Industry Use Cases for Central Monitoring System
In manufacturing, a CMS monitors PLCs, SCADA systems, and industrial IoT sensors to detect anomalies in production lines. For example, a textile factory in Bandung uses a CMS to track motor temperatures and vibration, reducing unplanned downtime by 30%. In banking, CMS ensures compliance with BI regulations by monitoring transaction servers and network devices across branches. A Jakarta-based bank implemented CMS to alert on failed transactions, improving SLA adherence from 95% to 99.5%. In healthcare, a hospital in Surabaya monitors MRI machines and patient data servers, with alerts sent to IT staff via WhatsApp, ensuring 24/7 uptime for critical systems.
Retail chains use CMS to monitor POS systems and inventory databases across hundreds of stores. A retail company in Jakarta deployed CMS with Networking monitoring to detect POS outages, reducing checkout downtime by 40%. In logistics, a CMS tracks warehouse servers and GPS tracking systems, enabling real-time visibility of asset location. For data centers, CMS integrates with Enterprise CCTV to correlate environmental alerts with video feeds. These use cases demonstrate how a CMS drives operational excellence across diverse verticals.
Central Monitoring System vs Traditional Alternatives
Traditional monitoring relied on siloed tools—one for servers, another for networks, and manual log checking. This approach led to delayed incident response, high operational overhead, and lack of correlation between events. For instance, a server failure might be reported hours after network issues were ignored. In contrast, a CMS provides unified visibility, automated alert correlation, and root-cause analysis. Traditional tools often require separate consoles and training, while CMS reduces training costs by offering a single interface. Moreover, legacy systems lack scalability for modern hybrid infrastructures.
A CMS also offers advanced features like predictive analytics using machine learning, which traditional tools lack. For example, a CMS can forecast disk failure based on S.M.A.R.T. data, enabling proactive replacement. Integration with IT Infrastructure solutions like VMware allows dynamic resource allocation. In Indonesia, where skilled IT staff are scarce, a CMS reduces dependency on manual monitoring. The total cost of ownership (TCO) is lower due to reduced downtime and efficient resource utilization. A study shows enterprises using CMS achieve 50% faster incident resolution compared to traditional methods.
Case Study & Implementation Methodology
A logistics company in Jakarta with 200+ trucks and 5 warehouses faced frequent server crashes due to overheating in storage areas. Challenge: 15 unplanned outages per month, average 4-hour downtime, costing IDR 500 million monthly. Solution: Deployed Zabbix CMS on Server & Storage from HP with temperature sensors and SNMP monitoring. Integrated with Synology NAS for log storage. Result: Outages reduced to 2 per month, downtime cut to 30 minutes, saving IDR 450 million monthly. Implementation followed a phased methodology: Phase 1 (2 weeks) – asset discovery and agent deployment; Phase 2 (1 week) – threshold tuning and alert configuration; Phase 3 (1 week) – dashboard customization and training; Phase 4 (ongoing) – optimization and scaling.
A manufacturing company in Surabaya with 50+ machines on the production floor had no real-time visibility into machine health. Challenge: 10% production loss due to undetected motor failures. Solution: Implemented PRTG CMS with Modbus TCP probes and Hybrid Cloud integration for remote access. Result: Production loss reduced to 2%, with predictive maintenance saving IDR 200 million annually. The methodology included a pilot on 10 machines, then scaled to all 50 within 3 weeks. Both cases highlight the importance of structured deployment and measurable ROI.