Monitoring Solution Architecture
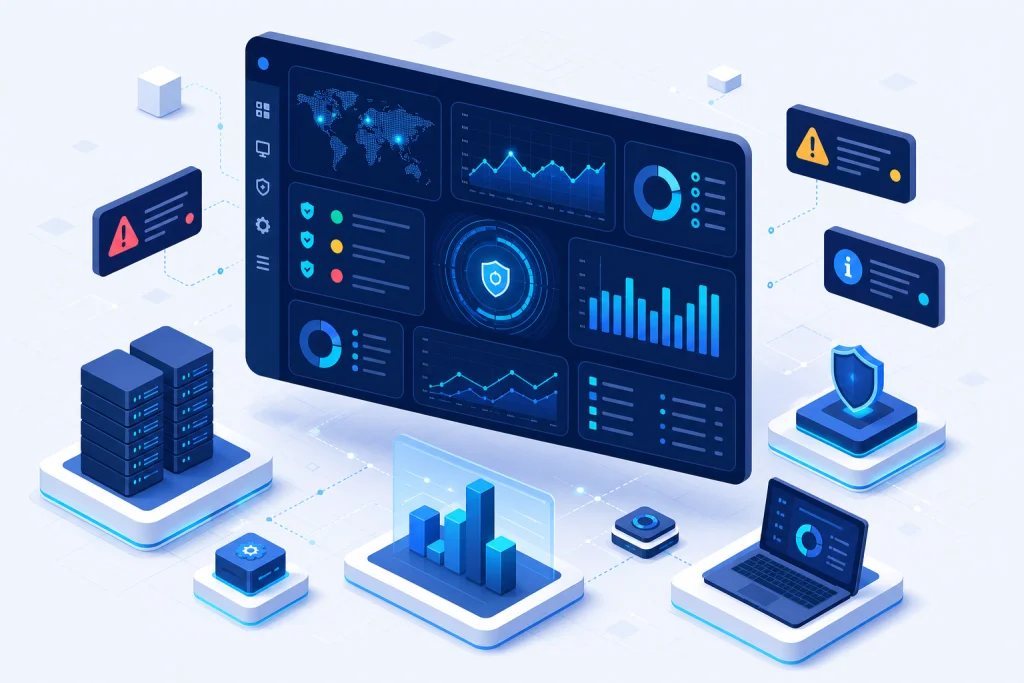
The monitoring solution architecture is designed for high availability and scalability, utilizing a distributed collector-agent model. Central management servers run on hyperconverged infrastructure or cloud instances, while lightweight agents are deployed across servers, network devices, and endpoints. Data ingestion uses protocols like SNMP, WMI, Syslog, and REST APIs, supporting both agent-based and agentless monitoring. The platform employs a time-series database for metric storage, enabling sub-second query performance and long-term trend analysis.
Key components include a data processing pipeline with stream processing for real-time alerts, a machine learning engine for anomaly detection, and a visualization layer with customizable dashboards. Integration with Synology and QNAP storage arrays ensures that log data is retained for compliance. The architecture also supports federated monitoring across multiple data centers, with role-based access control for different IT teams. Redundancy is achieved through active-active management nodes and automatic failover, ensuring 99.99% uptime for the monitoring system itself.
Industry Use Cases for Monitoring Solution
In the financial sector, a bank in Jakarta deployed our monitoring solution to oversee 500+ servers and 200 network devices across branches. Real-time transaction monitoring reduced incident response time by 60%, and automated alerting prevented revenue loss from downtime. For manufacturing, a plant in Surabaya uses the solution to monitor PLCs and SCADA systems, integrating with IT infrastructure to predict equipment failures, cutting unplanned downtime by 40%.
In healthcare, a hospital group in Bandung monitors critical applications and medical devices, ensuring HIPAA compliance through audit logs and access controls. The solution also supports retail chains in Jakarta, tracking POS systems and warehouse IoT sensors, improving inventory accuracy by 25%. These use cases demonstrate the versatility of our monitoring platform across diverse enterprise environments.
Monitoring Solution vs Traditional Alternatives
Traditional monitoring tools often rely on siloed, legacy systems like Nagios or SolarWinds, which lack scalability and require manual configuration. Our solution offers a unified, AI-driven approach that reduces alert fatigue by correlating events and suppressing noise. Unlike traditional alternatives, it provides out-of-the-box integrations with modern technologies like Kubernetes, Docker, and cloud services (AWS, Azure, GCP).
Additionally, our platform includes predictive analytics that forecast capacity needs, whereas traditional tools only react to thresholds. For example, a Dell server farm monitored with our solution can automatically scale resources based on workload patterns. The total cost of ownership is lower due to reduced manual effort and fewer false positives, with ROI typically achieved within six months. Traditional alternatives also lack the vendor-agnostic flexibility that our solution offers, supporting multi-vendor environments seamlessly.
Case Study & Implementation Methodology
A logistics company in Jakarta, Challenge: 15% unplanned downtime across 300+ servers and 50 network switches, causing shipment delays. Solution: Deployed our monitoring platform with HP server sensors and Cisco switch telemetry, integrated with backup and disaster recovery systems. Result: 90% reduction in MTTD (from 45 minutes to 4.5 minutes), 70% fewer critical incidents, and 20% improvement in server utilization within 3 months.
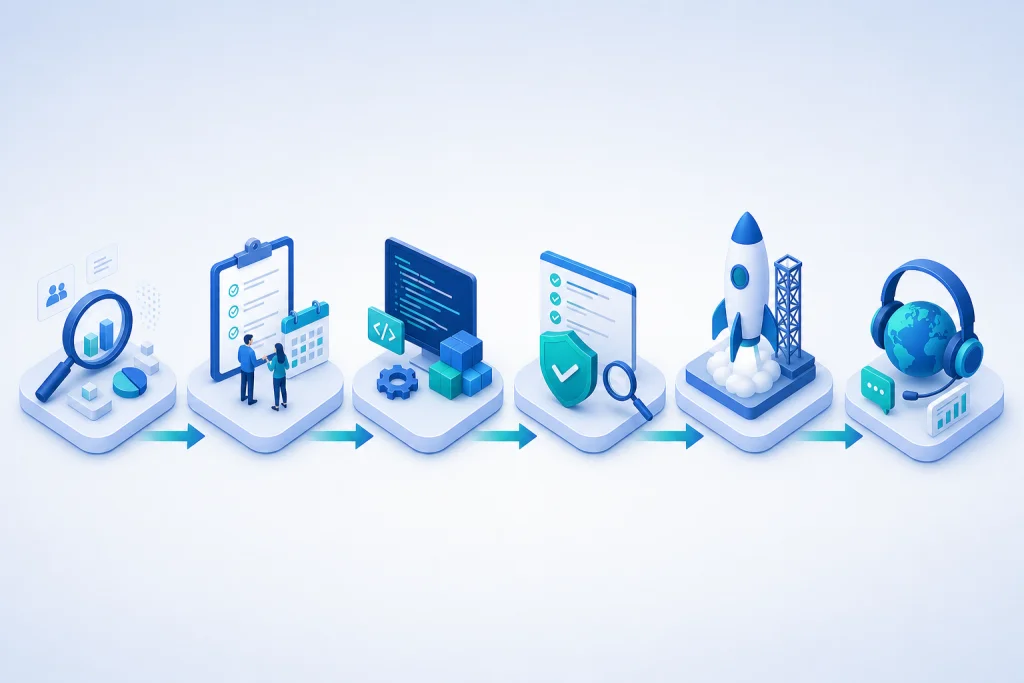
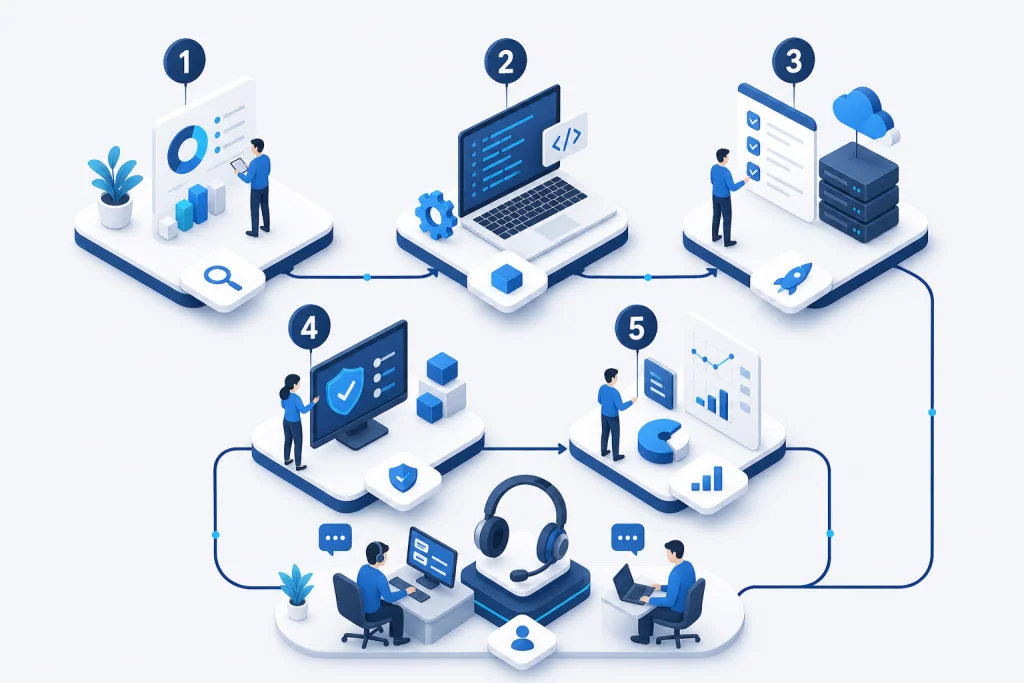
Implementation follows a phased methodology: Phase 1 – Discovery and design, including asset inventory and threshold tuning. Phase 2 – Pilot deployment on 50 devices, with validation of alert accuracy. Phase 3 – Full rollout across all locations, with training and documentation. Phase 4 – Continuous optimization using AI models. This structured approach ensures minimal disruption and maximum adoption.